Imagination staff portal dashboard
Sales

Booking & Agent Production

Source: Production Indicator 2026

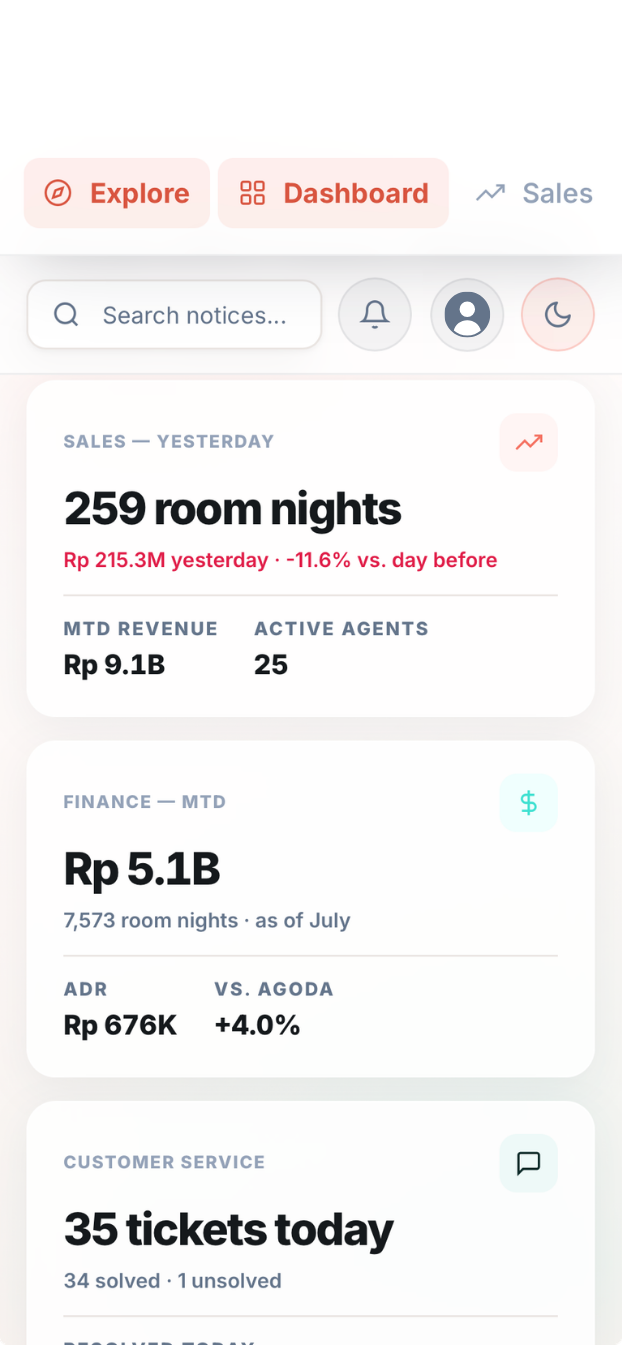
Room Nights Yesterday
—
loading...
Room Revenue Yesterday
—
gross, all agencies
Active Agents
—
across network
Daily room nights & revenue — August
Top performing agents — August
AgentRoom NightsRoom RevenueStatus
Loading...
Customer Service

Tickets performance

Source: CS Ticketing — HCN tab · Productivity tab · SLA Customer Service — Cases tab

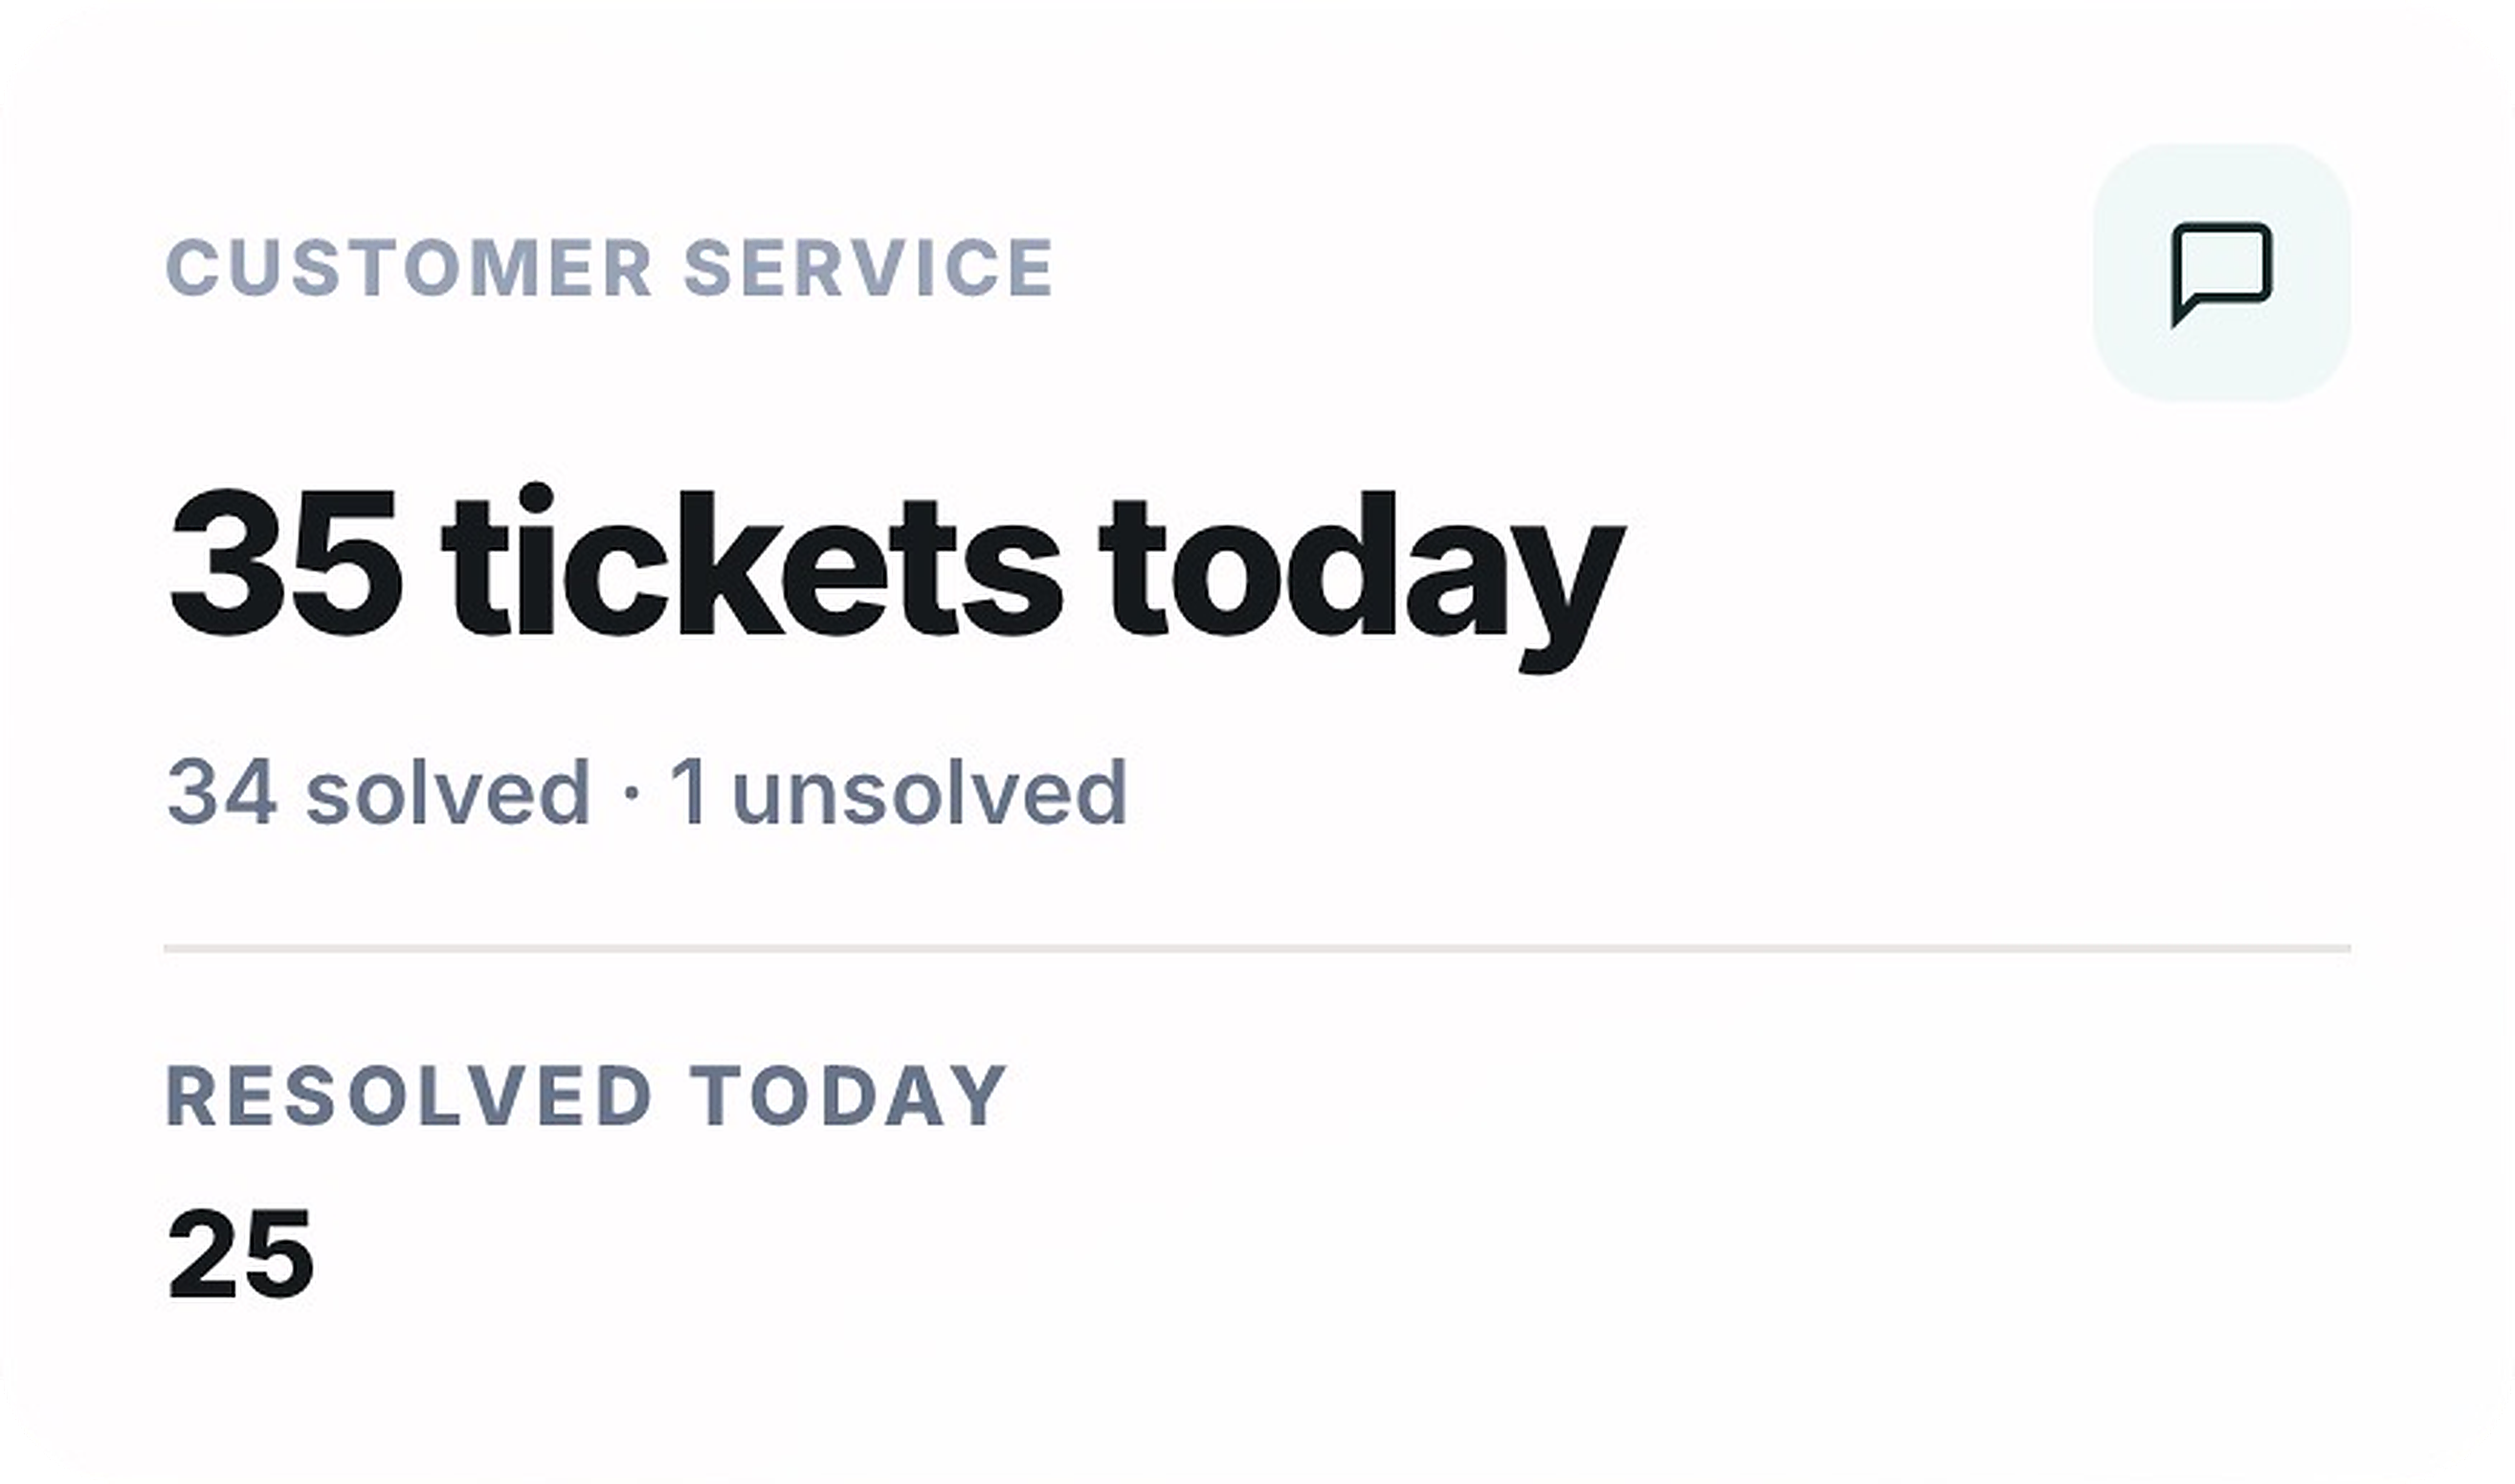
Open Tickets
—
opened in last 30 days, unsolved
Resolved Today
—
HCN daily follow-up · SLA HCN tab
Solved — Last 30 Days
—
All Time Solved · SLA HCN tab
Overdue Tickets
—
past SLA due date, still open
SLA — This Week
—
SLA Customer Service · SLA all time tab
Last 8 weeks
HCN — To Chase
—
no confirmation number yet, hotel not contacted · Non Archi tab
HCN — Waiting on Hotel
—
hotel contacted, awaiting their reply · On Progress tab
HCN cases solved — last 30 days
—
All Time Solved · SLA HCN tab
Tickets by category
Tickets solved — last 30 days
—
Tickets by priority
Agent leaderboard
AgentTicketsOverdueAvg hours
Loading...
Recent tickets
TicketHotelCommentsStatusDate createdHours
Loading...
Finance

Revenue, rate & production

Source: Revman Revenue Production Report · IMAGTC Daily Rate Comparison (vs. Agoda)

Restricted — Finance & Leadership
Daily revenue report
Revenue MTD
—
month to date
Room Nights MTD
—
total room nights
Avg. Daily Rate (ADR)
—
blended network
Rate Competitiveness
—
vs. Agoda
Revenue — year to date, by week
Our rate vs. Agoda (IDR, Nett)
Revenue by property (MTD)
PropertyRevenueRoom NightsADR
Loading...
Imagination vs. Agoda — daily rate comparison (Nett, IDR) loading...
PropertyOur Rate (Nett)AgodaVariance
Loading...
Marketing

Social & digital performance

Source: Meta Business Suite export (Marketing Drive folder)

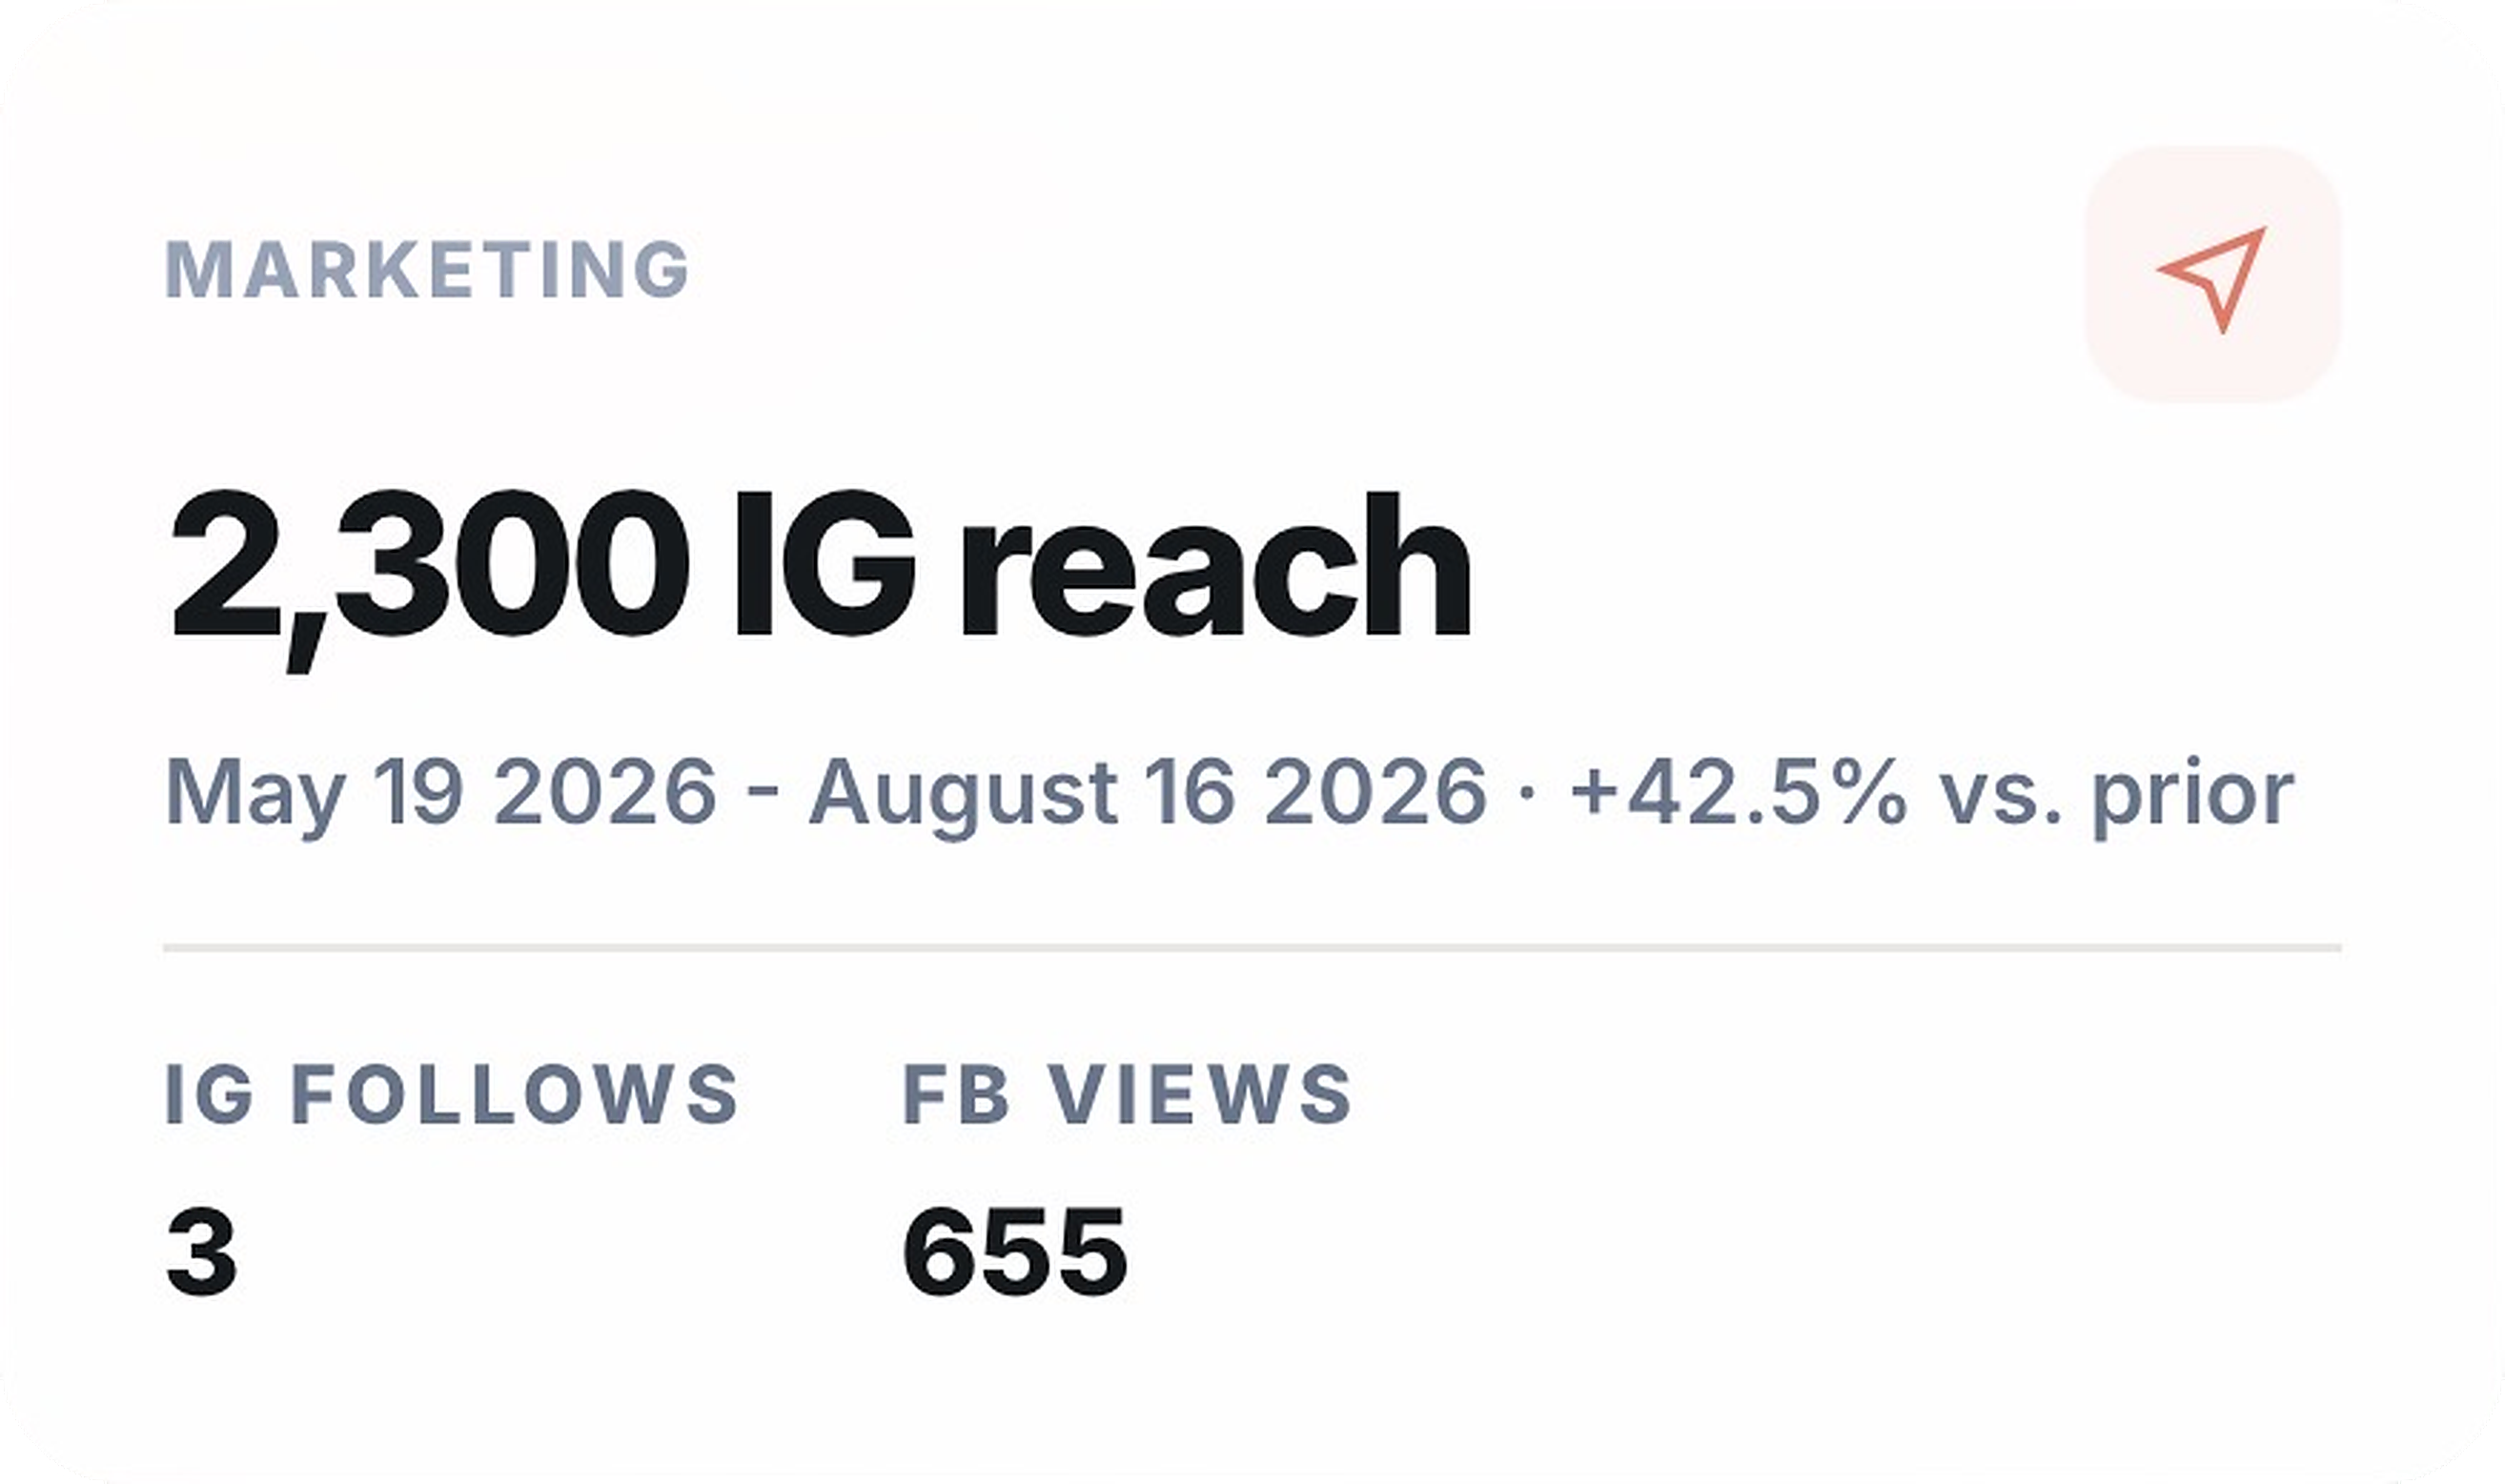
Instagram
Views
—
vs. prior period
Reach
—
vs. prior period
Follows
—
vs. prior period
Content Interactions
—
vs. prior period
Feed Posts
—
vs. prior period
Stories Published
—
vs. prior period
Lifetime Feed Views
—
vs. prior period
Lifetime Interactions
—
vs. prior period
Facebook
Views
—
vs. prior period
Unique Viewers
—
vs. prior period
Video Views
—
vs. prior period
Watch Time
—
vs. prior period
Content Interactions
—
vs. prior period
Link Clicks vs. prior period
Visits
—
vs. prior period
Follows
—
vs. prior period
Instagram views — breakdown
Facebook views — by format
Full metric breakdown — this period
MetricTotalChangeBreakdown
Loading...
Contracting

Hotel acquisition & renewal pipeline

Source: 2026 Acquisition Report — Target & Achievement, Summary, and monthly activity tabs

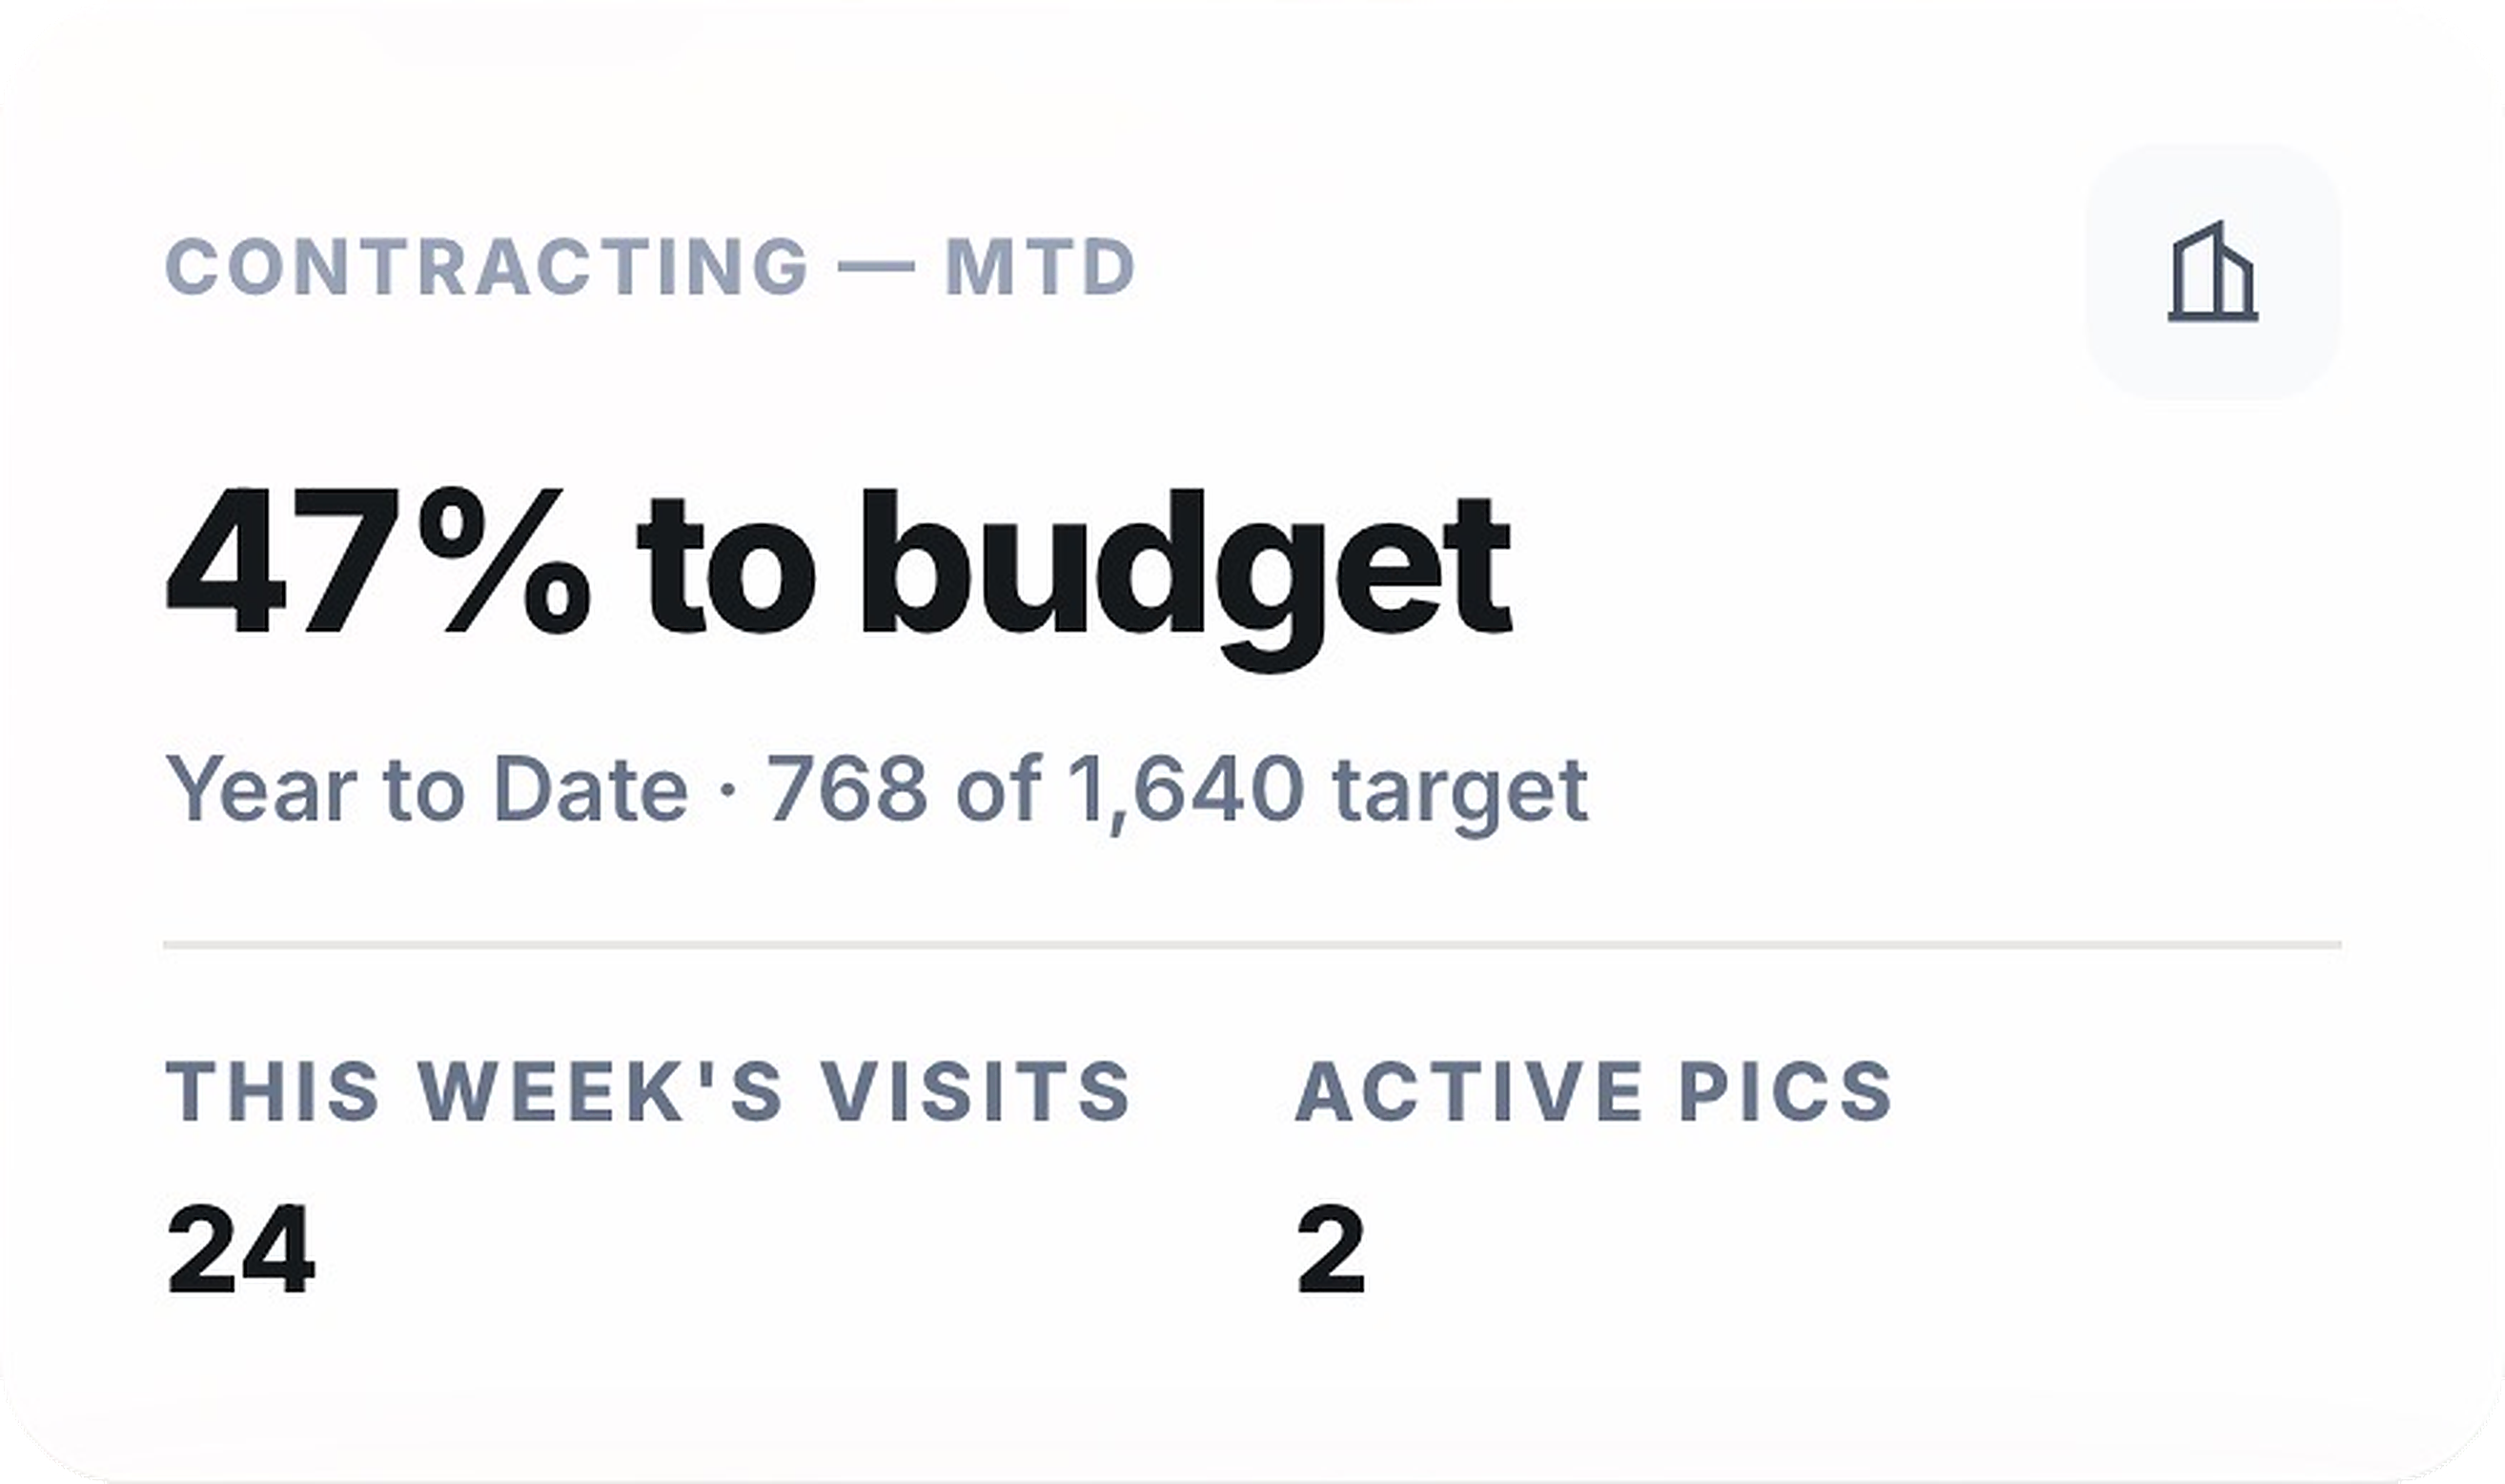
Budget
—
full-year target, team
Achievement
—
year to date, team
% to Target
—
achievement vs. budget
Budget vs. Achievement
Deal mix by month — Static / Dynamic / Renewal
PIC leaderboard — Year to Date
PICBudgetAchievement% to Target
Loading...
Recent activity most recently listed first
HotelPICStatusRate Plan
Loading...
Deposit Utilization

Deposit completion planner

Choose 1–12 months for each hotel to calculate the sales pace needed to use its remaining deposit.

Assumption: Rp 1 of eligible sales reduces the deposit by Rp 1
Deposit hotels
—
active deposits
Initial deposit
—
portfolio total
Deposit remaining
—
still to utilize
Utilization
—
used ÷ initial deposit
Deposit balance by hotel

Used and remaining balance

Per-hotel completion targets

Change the timeframe independently for each hotel.

Average month = 30.44 days
HotelInitial depositUsedRemainingUtilizationFinish withinRequired / monthRequired / dayCurrent / dayPace status
Loading deposit data...
Weekly Field Activity

Hotel visits & telemarketing calls

Source: 2026 Daily Hotel Visit Report — one tab per week

Total visits/calls
—
selected week
Hotel visits
—
in-person
Telemarketing calls
—
phone outreach
Hotels contacted
—
unique, selected week
Recent visits & calls
DateHotelContactTypePICRemarks
Loading...
Visits by PIC
PICVisits
Loading...